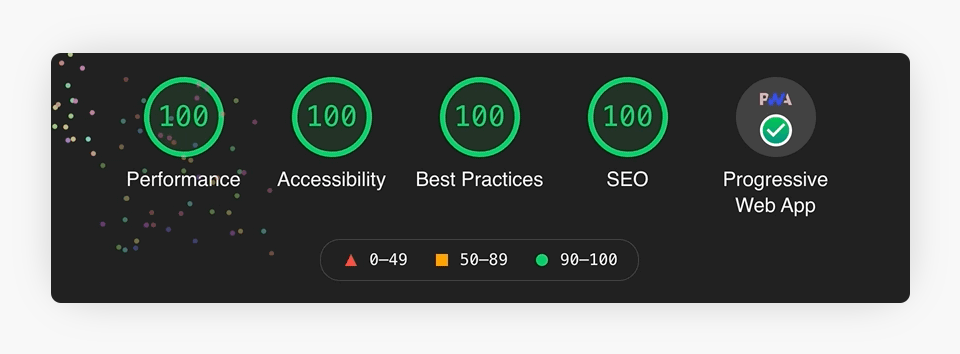
In the last year or so there has been a trend of developers and agencies posting perfect Lighthouse scores on social channels. You’ve probably seen them, those 4 green circles, each with a 100 in the middle.
This looks great, surely they’re doing a good job, but are they representative of the whole picture when it comes to performance testing the website in question? Or are they just the best test score achieved?
Zach Leatherman has recently written The Art of Deception, Lighthouse Score Edition highlighting the issues with running Lighthouse tests in favourable conditions with ambiguous presentations of results.
I recommend reading the article in full. It’s clearly written and easy to understand, and highlights some excellent points and concerns for website owners and developers alike.
To summarise though, perfect lighthouse scores presented without context and transparency can’t be completely trusted. They may have been tested locally on high performance machines, rather than in a controlled setting more representative of the “real world”.
Scores might only show the desktop results which are typically higher than mobile versions. Yet the majority of sites now see a roughly even split in traffic sources. So what are mobile users experiencing?
Lighthouse does tend to provide fluctuations in results, so how can you be sure the test hasn’t been run multiple times and the best score taken?
I’m not suggesting that everyone is posting false scores. More the fact that we should all be a little bit more aware about the accuracy of testing. It’s important not to do our users a disservice, and ensure that performance is good across the board for everyone, regardless of technology and location.